-
Title (Dublin Core)
-
Tri-metrogon process as a fast and accurate method for aerial mapping
-
Article Title and/or Image Caption (Dublin Core)
-
Superspeed mapping puts our flyers ahead
-
extracted text (Extract Text)
-
HE science of charting, for generations
TEs to the man on foot or on horse-
back, has finally caught up with the man
in a P-38. Using a wholly new and simplified
technique, the Army Air Forces in the past
year have charted 3,000,000 square miles of
rugged, remote country—an area that would
have taken more than 30 years to map by
old methods. This amazing achievement, an
average of nearly 8,000 square miles a day,
was made possible by the tri-metrogon
process, perfected since Pearl Harbor.
The process, named for the lenses in the
compact three-camera unit with which the
master photographs are made, was developed
by Col. Minton W. Kaye, commanding officer
of the First Photo Charting Group, Army
Air Forces, and Lt. Col. Gerald Fitzgerald,
chief of the Aeronautical Chart Service,
formerly of the Alaskan Branch of the U.S.
Geological Survey. It is so simplified that
one airman can now photograph 20,000
square miles in less than half a day, and
the transfer technique is so swift that not
long ago a finished map of 89,000 square
miles in Africa was produced just seven
days after the photographs arrived at the
compiling unit.
Aerial mapping is not new. It was used
during World War I. But old methods were
either fast and inaccurate, or accurate and
slow. In more recent methods, highly com-
plicated and expensive cameras, some of
them taking as many as nine pictures simul-
taneously, were used. It took a year, how-
ever, to train a man to operate them; and
after the pictures were made, a staff of ex-
perts was needed to transfer photographic
detail to planimetric maps by slow, tedious
processes. Tri-metrogon, by contrast, does
an accurate job quickly and with a minimum
number of specialists.
The easiest way to see how this is done
is to follow a tri-metrogon project through
from start to finish.
It begins with field work, as does any
mapping job. The area to be charted is first
laid out on the best available maps of the
district, which often are no more than guess-
work sketches. Flight lines are indicated
and well-distributed geodetic control points
are chosen—river junctions, promontories,
lakes, islands. These points must be located
with absolute accuracy, for they become the
figurative corner posts on which the whole
map will be squared.
Field parties, each consisting of from
two to four Air Corps men, are sent out
to establish astronomic control and make
accurate descriptions of each point, so it
can be identified on subsequent aerial photo-
graphs. Ideally, control points should be
about 50 miles apart. To reach them is often
back-breaking work, for although the field
parties are flown as close as possible to the
control points, they often have to go in by
boat, by dog sled, or on foot. But on their
work depends the ultimate geodetic accu-
racy of the map.
Field work, under the best conditions, is
relatively slow. However, while it is going
on, the aerial photographers begin their as-
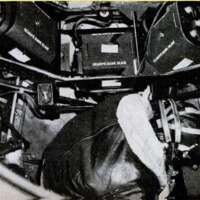
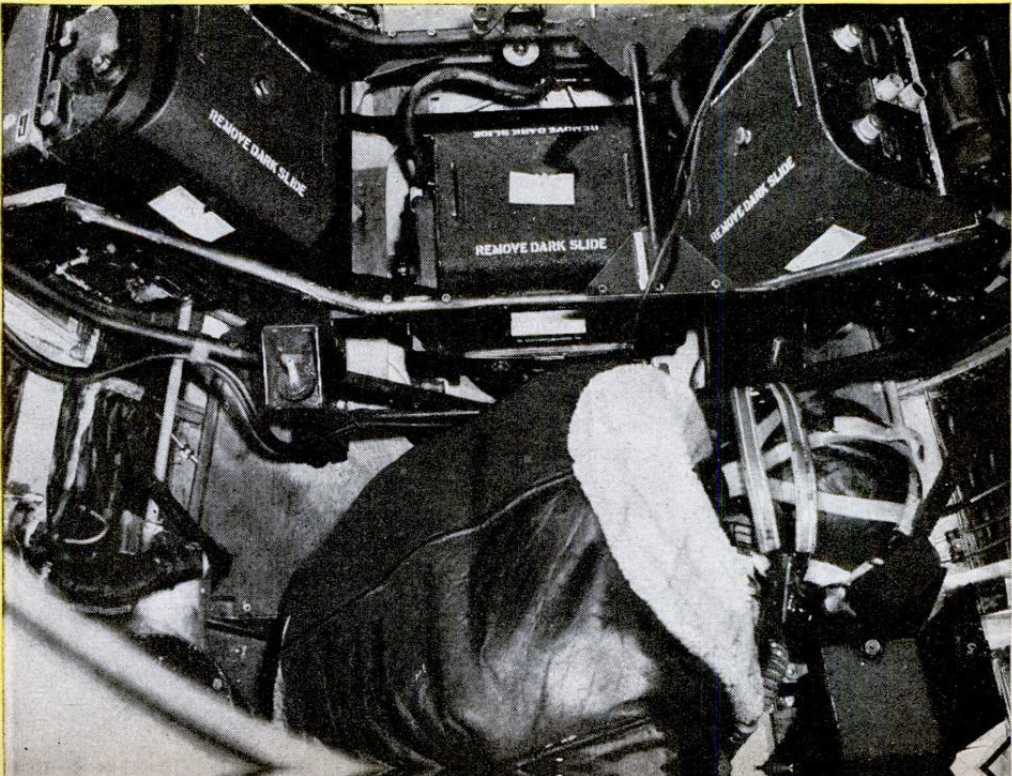
signments. In the photographic planes,
they fly parallel courses about 25 miles
apart, considerably farther than in the old
‘mapping methods. The tri-metrogon camera.
unit takes three pictures at a time, one
vertical and two matching obliques, that
cover a six-mile strip from horizon to
horizon. The cameras have wide-angle lenses
of six-inch focal length, and automatically
take a strip of pictures every three miles,
which provides sufficient overlap for final
assembly. Photographic flights are made
at approximately 20,000 feet.
When a flight area has been photographed,
film is processed, and prints are made when-
ever possible in the field at the temporary
headquarters of the Photographic Squadron.
In some cases, the film is forwarded to this
country for final printing. Field printing is
desirable because it offers an opportunity
to check photographic coverage. The nega-
tives are titled with project number, date,
location, roll, strip, and exposure number,
and the prints are indexed.
Two sets of contact prints are forwarded
to the Army Air Forces Aeronautical Chart
Service in Washington, which files one set
for permanent record in the Central Film
Library and forwards the working set to
one of the three Army Air Forces Compila-
tion_Units—one in Washington, D. C., one
in St. Louis, Mo. and one in Colorado
Springs, Colo. Now comes “translation.”
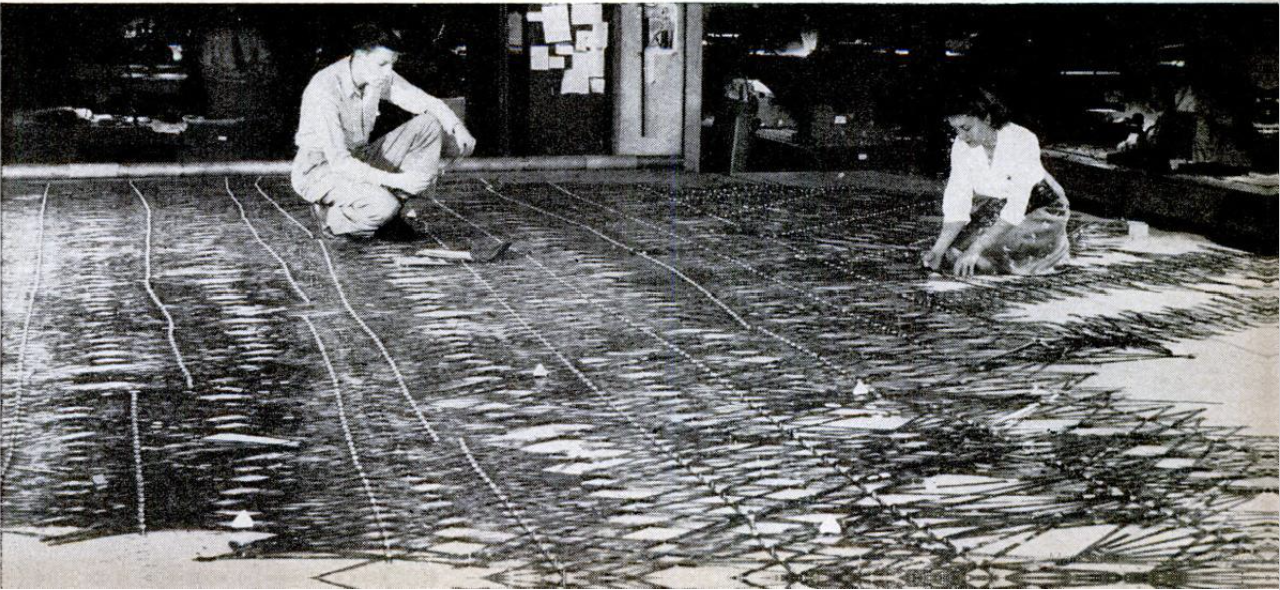
From here on, every operator on the
job-—there are 250 in the Washington unit,
half of them women-—has what amounts to
a grandstand seat 20,000 feet above the
area being mapped. With specially de-
veloped instruments they can see, in three
dimensions, mountains and valleys that may
never have felt man's footstep . . . can
calculate the height
of every peak in a mountain range without
getting out of their comfortable chairs . . .
can even scan 150 miles of escarpment or
follow a river to its headwaters and never
leave their desks. They sit in the seats of
the gods and make charts for men who
consort with the stars.
The first step in converting photographs
into charts goes right back to the first
step in the field work. Geodetic control
points must be found and identified. Field-
party notes show, for instance, that point 6
is the junction of two rivers at a given
latitude and longitude. The index map
shows this point to be on vertical photo-
graph 74, and also to appear on 73 and 75.
Field notes give the direction of each river's
course, angle of junction, and bearing of
three near-by mountains.
The laboratory man pita pictures 73 and
74 under his stereoscope and in five minutes.
can_ explore hundreds of square miles of
country through which the field parties
labored painfully for days. He finds the
river junction and identifying mountains,
Verifies the river courses, and checks what
he can see against what the field party re-
ported, Satisfied at last, he marks the
geodetic point with a circle inscribed in a
triangle and similarly marks the same point
on_every photograph where It appears.
Now the technician figuratively steps into
the mapping plane. He must learn the
exact position of the plane and its direction
of fight when each picture was taken.
Updrafts tilt the plane. Cross winds cause
drift. He calculates these factors mathe-
matically from the relative position of
natural features in consecutive vertical
pictures and comparative horizon lines in
the oblique pietures. Azimuth lines, true
direction of fight, and plumb points—
precise verticals dropped from the camera's
position—are indicated on the picture.
Information is now in hand to begin
transferring detail from the photographs to
the map base. The first step is the charting.
of key points by triangulation on the recto-
blique plotter, an instrument for determin.
ing true horizontal angles from an oblique
photograph.
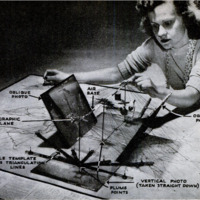
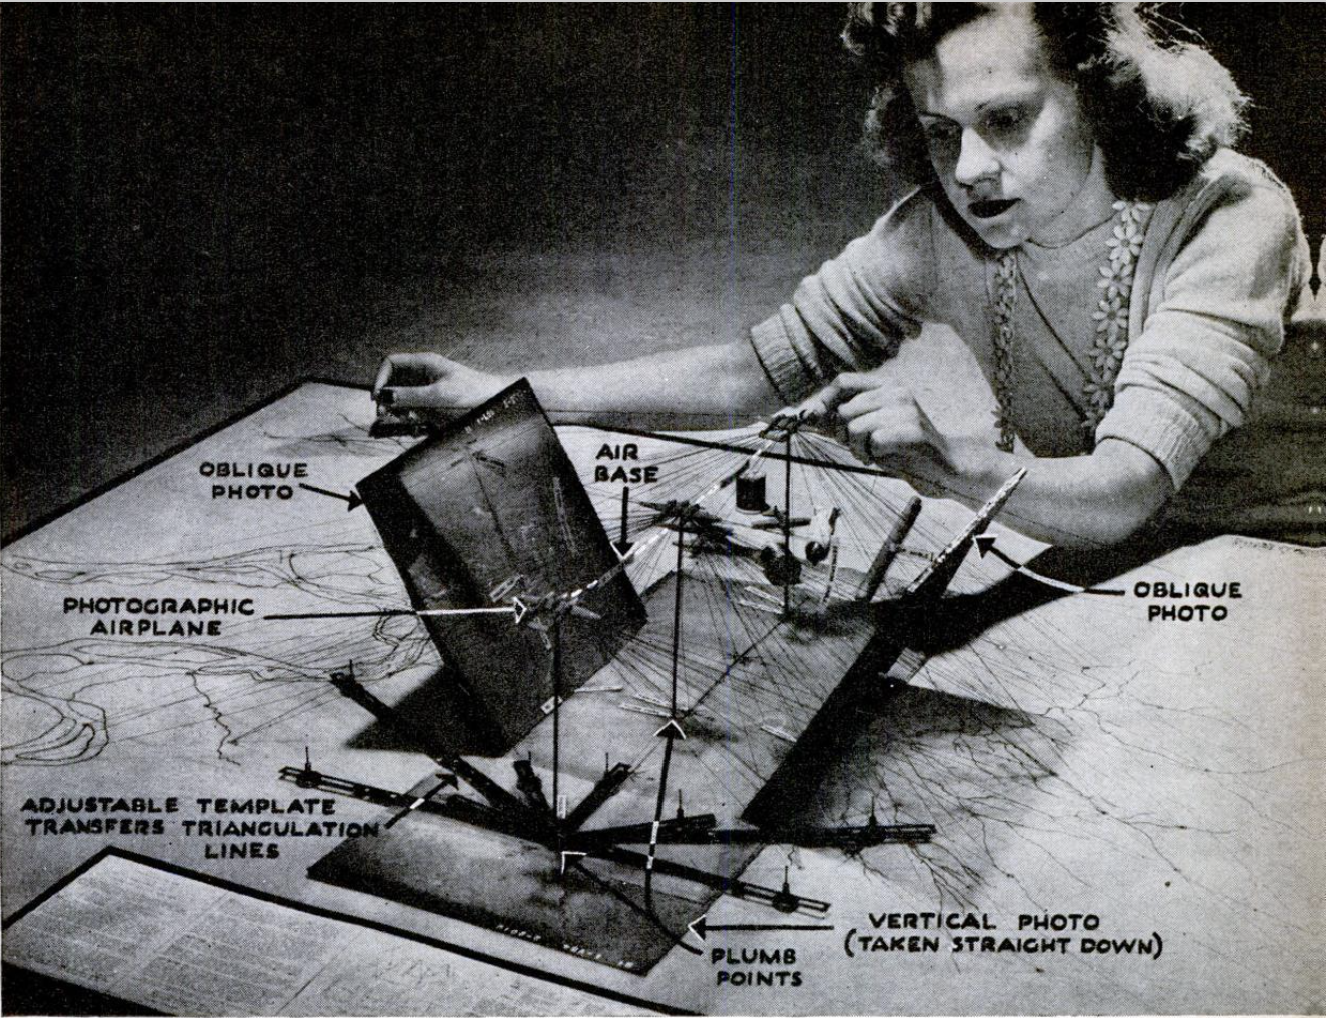
“An oblique photograph is squared on the
plotter with a pivot pin at its plumb point.
Alongside is fastened a transparent paper
template to which are transferred the photo-
graph's azimuth lines. A master pointer,
which swings on the pivot pin, is moved to
cach detail point on the photograph, and a
toggle moves a straightedge on the template
to a corresponding angle. By drawing lines
along the straightedge, the operator con-
structs a series of radiating rays—tri-
angulation lines—which are numbered ac-
cording to the photograph’s detail-point
numbers. Assemble a sequence of paper
templates, and these detail points will be
located at the intersections of similarly
numbered lines.
To transfer this information to the huge |
sheet of cellulose acetate which becomes the
map base, still another short cut is used.
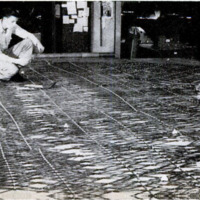
A metal template is made for each paper
template by assembling slotted spring-steel
strips around a hub corresponding to the
paper template’s plumb point. When these |
metal templates are mounted in order on
the acetate sheet, the intersecting rays are
connected by studs which allow adjustment
of the whole layout. Now the triangulation
has become mechanical, and when the whole
layout is complete, a marking pin is driven
through the stud at each detail-point inter-
section into the map base. These pin points
are marked and numbered on the map base
with celluloid ink, and the metal templates
are taken up.
The skeleton of the finished map is now |
ready to receive the details that will give it
life. Key points are in place. Directions are
established. Relationship of flight pictures
is determined, |
Meanwhile, the photographs have been
studied under magnifying stereoscopes, and
features to be shown on the finished map
have been outlined in ink, Now the map
base is cut into three-foot strips and
sent, with corresponding pictures, to detail
sketchers. By placing the photographs in a
camera-lucida type of instrument called a
“sketchmaster,” the operator can project
the image of the photograph onto the acetate
base. Adjustments bring the image into
proper scale, match its key points with those
on the map, and compensate for tilt and
distortion. This done, the operator draws
the photographic detail on the map base.
With this detail on it, the master map is
edited, checked, and labeled with known
place names. After inking, it is a master
transparency of a planimetric chart, show-
ing all important surface features. Nega-
tives can be made from it, reduced to desired
scale, and emergency maps can be printed.
But it still lacks contour detail and radio
and aeronautical data.
For contour detail the photographs are
checked through another specialty instru-
ment, the photoalidade—a small, high-
precision telescope mounted on trunnions
and calibrated for vertical angles. With it
an operator can, in effect, sit almost four
miles above the earth and vertically tri-
angulate any point shown on the oblique
photograph in front of him. The data he
provides is transferred to the chart, and
final proofs are made. Separate sheets are
inked for each contour tint, for drainage,
for culture features, and for the latest
radio and aeronautical data. From these
sheets, full-color charts can be printed.
Tri-metrogon charts are primarily for
aerial use, although they have been used
by ground reconnaissance forces. Ground
engineers are sometimes critical, saying
they may deviate two or three hundred
yards in their accuracy. Armen say such
criticism is captious because these charts
replace maps on which mountains and
rivers often are shown many miles out of
position—if they are shown at all.
Wartime transport demanded and tri-
metrogon achieved, virtually overnight,
working charts of the Far North, of South
American jungles, of interior Africa, of re-
mote Asia. Man had never even seen some
of these areas from the air before.
Like much of the war transport itself and
the supporting ground work, tri-metrogon
charting has developed with unbelievable
speed. Its very existence was unknown to
the public a year ago, and its details have
only recently been revealed.
‘While the routes now covered by tri-
metrogon charts are a military secret, it
can be stated that the Army Air Forces
have photographed more than 5,000,000
square miles, and its Compilation Units
have translated three fifths of these photo-
graphs into maps and aeronautical charts.
This tremendous task unquestionably is the
largest single mapping contribution ever
made; and for many years of postwar ad-
justments, these photographs, maps, and
charts will play an important part, not only
in aviation, but in the intensive develop-
ment of natural resources in little-known
parts of the world.
The particular function of tri-metrogon
instruments and techniques, however, is to
do a quick, thorough job of charting for the
airman. And before the war is over, our
military files will include working charts
of every major air route needed, not only
for war, but for the tremendously expanded
Air Age that will follow.—HAL BORLAND.
-
Contributor (Dublin Core)
-
Hal Borland (article writer)
-
William W. Morris (photographer)
-
Language (Dublin Core)
-
eng
-
Date Issued (Dublin Core)
-
1944-01
-
pages (Bibliographic Ontology)
-
68-72 , 188 , 192, 194
-
Rights (Dublin Core)
-
Public Domain (Google digitized)
-
Archived by (Dublin Core)
-
Lorenzo Chinellato
-
Marco Bortolami (editor)

 Popular Science Monthly, v. 144, n. 1, 1944